Dictionary of Mathematical Eponymy: The Gray Graph
What is the Gray Graph?
Imagine a Rubik’s cube – just for visualisation purposes, we’re not solving it or anything. It’s got 27 cubelets (including the middle). It also has 27 lines of three cubelets parallel to the axes (nine in each direction).
Here comes the graph: represent each of the lines and each of the cubelets by a node in the graph. Two nodes are connected if and only if the cubelet represented by one node lies on the line represented by the other.
Here are two pictures of it:
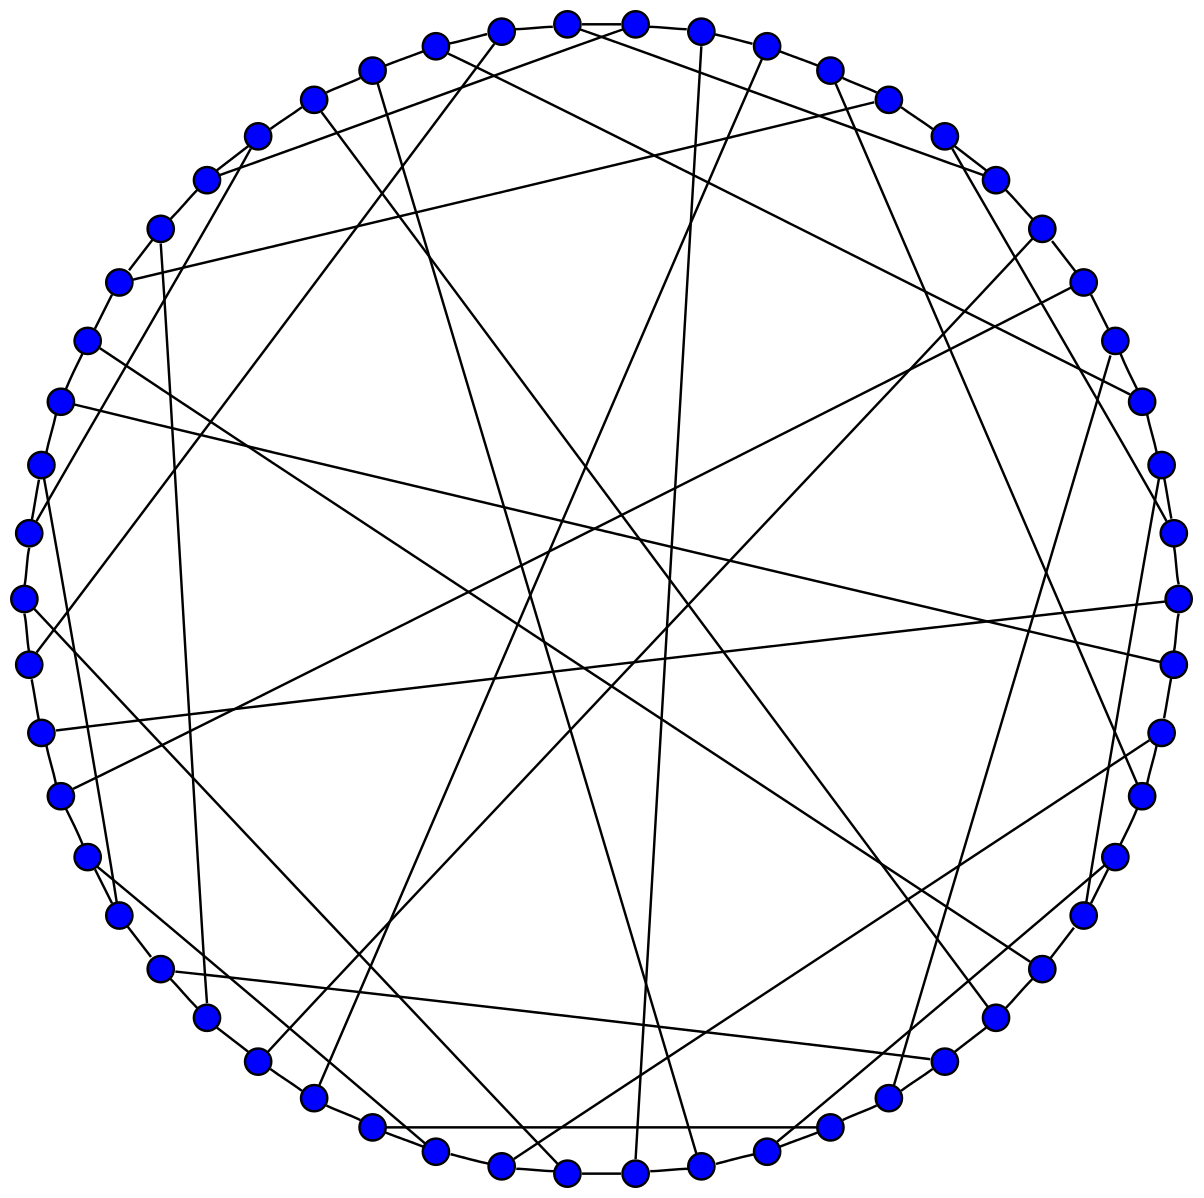
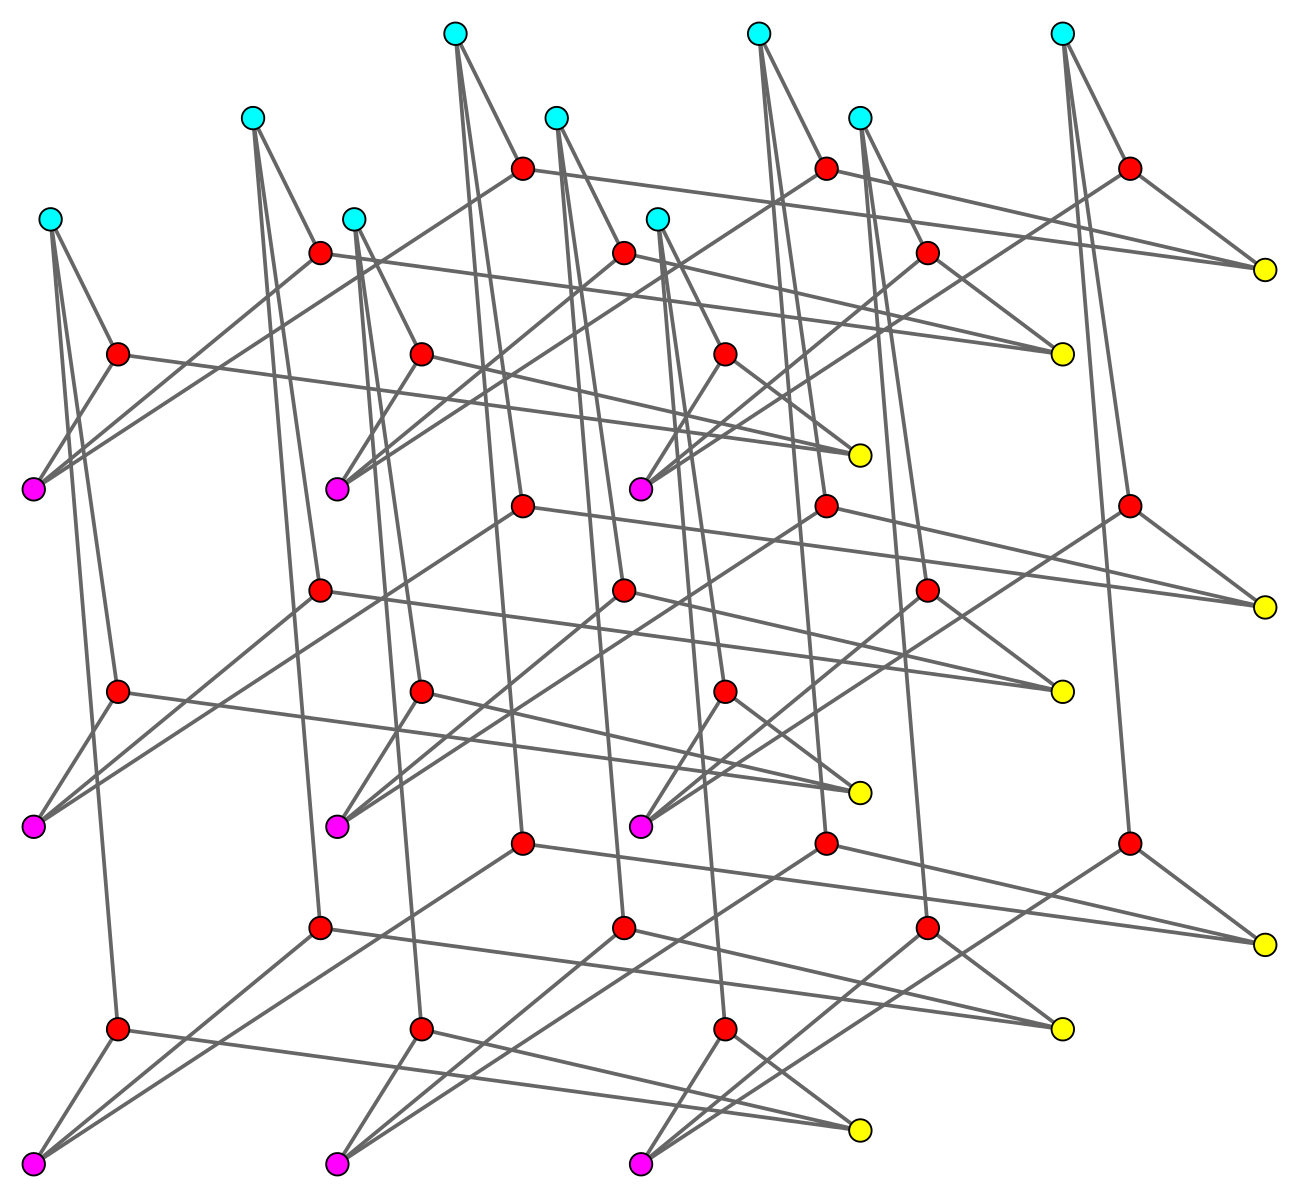
Since each cubelet lies on three lines (and each line passes through three cubelets), the graph has 81 edges linking the 54 nodes.
Why is it important?
The Gray graph is the smallest possible cubic semi-symmetric graph: any pair of edges can be transformed one into the other, but that’s not true of the nodes – you can’t transform a node representing a line into a node representing a cubelet or vice versa.
I’m not certain why this is significant – but it has a neat picture. Gray apparently thought similarly; she thought it a curiosity and didn’t bother to publish it. It was studied by Bouwer in the 1970s and found to answer some questions about symmetries.
Who was Marion Cameron Gray?
Marion Gray was born in Ayr, Scotland in 1902 and studied mathematics and natural philosophy at Edinburgh, graduating with a first-class degree. In the 1920s, she gained her PhD at Bryn Mawr College, Pennsylvania.
In 1930, she joined AT&T as an engineer, where she came up with the Gray graph in 1932. From 1934 until her retirement, she worked at Bell Labs, and served on all sorts of committees (including the one responsible for the goldmine Handbook of Mathematical Functions).
Gray died in Edinburgh, Scotland in 1977.